Case Study
Carbon Accounting Automation Platform
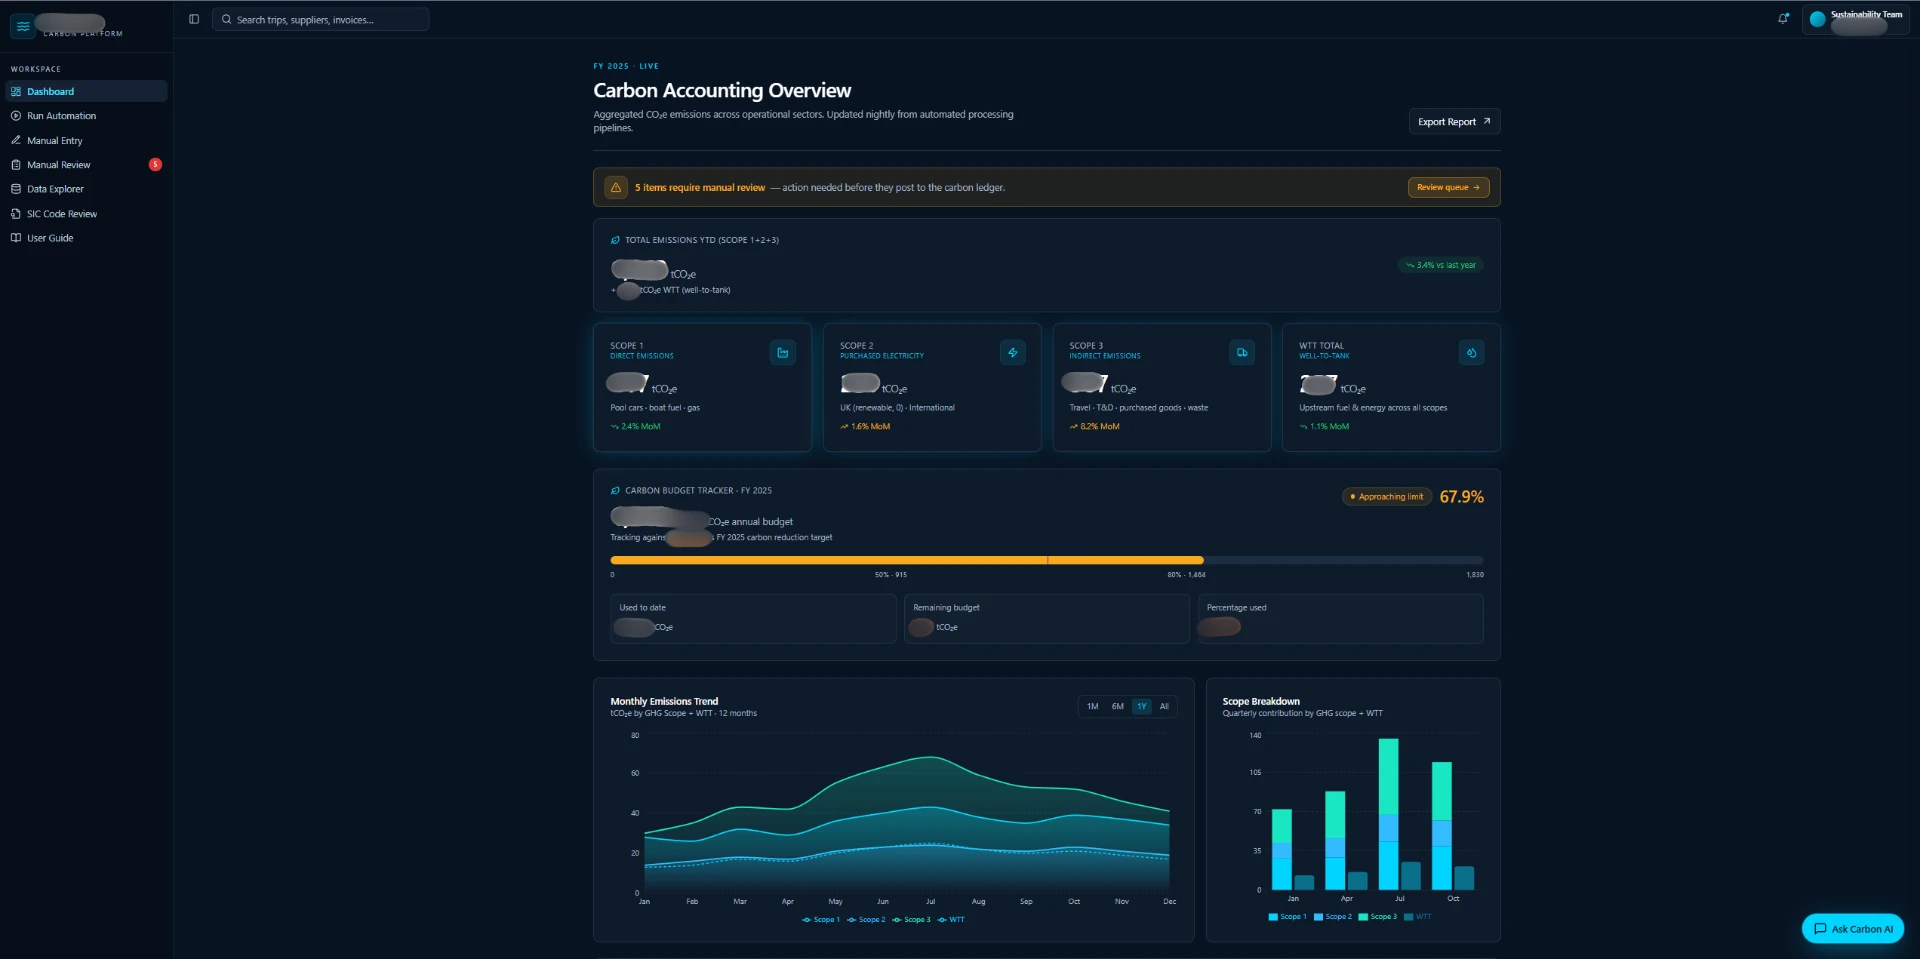
An end-to-end automation platform replacing a manual, per-invoice carbon accounting process: document and data extraction, AI-assisted classification, automated emissions calculation, human-in-the-loop review, and a live reporting dashboard.
17,000+
line items / year
7
sectors
1,000+
suppliers
99.4%
validated accuracy
Summary
- Problem
- Company-wide carbon emissions tracked manually across 7+ business sectors, with no automated validation, no audit trail, and no consistent process across data sources.
- Solution
- An end-to-end automation platform: document/data extraction, AI-assisted classification, automated emissions calculation, human-in-the-loop review, and a live reporting dashboard.
- Scope
- Taxi, boat fuel, company vehicles, UK electricity, UK gas, international travel (flights/hotels/hire cars), and purchased goods & services (1,000+ suppliers, 17,000+ line items/year).
- Stack
- n8n (orchestration), Supabase/Postgres (data layer), Azure Document Intelligence (OCR/extraction), Azure OpenAI (classification), Google Maps Routes API (distance calculation), Lovable (frontend).
- Validation
- Every sector independently reconciled against source documents and confirmed prior-year figures before go-live; several sectors matched at 99%+ accuracy.
- Outcome
- Replaced a fully manual, per-invoice calculation process with an automated pipeline that self-flags anything it can't confidently calculate, rather than estimating.
01
Business problem
Carbon accounting for a mid-sized engineering company spans far more than energy bills. It touches fleet fuel, taxi and travel spend, purchased goods, utilities, and international operations — each with its own data source, its own format, and its own reporting cadence.
The existing process handled this manually: emissions were calculated per invoice, using published government conversion factors, with figures compiled by hand into spreadsheets ahead of annual reporting deadlines. This is a standard approach for organisations at this stage of carbon reporting maturity, but it carries three structural limitations that any manual process of this kind will have:
- No automated cross-checking. A figure entered once is trusted; there's no independent mechanism to catch a transcription error, a missed invoice, or a miscalculated factor until an audit — if one happens at all.
- Inconsistent handling across data sources. Different sectors arrive in different formats (PDF invoices, Excel exports, CSV dumps from other systems), each requiring a different manual approach.
- No scalable path to sub-annual reporting. Producing quarterly, rather than annual, figures would multiply the manual workload directly, with no corresponding increase in headcount.
The brief was to reduce the manual burden without reducing accuracy — ideally improving it — while leaving a clear, auditable trail from source document to final figure.
02
Requirements & constraints
- Support 7 distinct emissions sectors, each with a different data shape and source format.
- Handle real-world document inconsistency: multiple suppliers per sector, format changes mid-year (including at least one supplier rebrand), and older invoice formats with incomplete data (e.g. missing postcodes needed for distance calculation).
- Never silently guess. Where a confident calculation isn't possible, the system must flag the item for human review with enough context to resolve it quickly — not drop it, and not estimate it.
- Support switching between reporting years' conversion factors without manual intervention, since UK government DEFRA factors update annually.
- Provide a live, non-technical dashboard so the sustainability team can see current totals, drill into any sector, and process review items themselves — without needing database or workflow access.
- Full audit trail: every calculated figure must be traceable back to its source file, extracted values, and the exact factor applied.
03
System architecture
High-level flow:
[Invoice / Data Source]
        │
        ▼
[Frontend Upload — Lovable]  ──► large files pushed to object storage,
        │                         workflow receives a signed URL, not the raw file
        ▼
[n8n Orchestration]
    ├─ Duplicate detection (file-hash + row-level)
    ├─ Extraction (Azure Document Intelligence / direct parsing)
    ├─ Classification (rules-based, or AI-assisted where appropriate)
    ├─ Year-aware factor lookup (DEFRA factors, selectable by reporting year)
    ├─ Calculation (CO2 / WTT)
    ├─ Plausibility check (sanity-check layer)
    └─ Route: confident result → output table │ uncertain result → review queue
        │
        ▼
[Supabase / Postgres]
    ├─ Per-sector output tables (source of truth for the dashboard)
    ├─ Review queues (per failure type, with reason + source reference)
    └─ Row Level Security enforced on every table
        │
        ▼
[Dashboard — Lovable]
    ├─ Live scope 1/2/3 totals, sector drill-down
    ├─ Manual Review queue (human resolves flagged items)
    ├─ SIC/supplier classification review (accept/reject AI suggestions)
    └─ Manual Entry (for anything genuinely outside automated scope)
Why this shape: the split between extraction, classification, calculation, and plausibility-checking as distinct pipeline stages — rather than one large per-sector script — meant each sector's workflow could fail independently, be tested independently, and be extended without risk to the others.
04
Data flow, by sector
Each sector follows the same pipeline shape, adapted to its own data:
| Sector | Source format | Extraction method | Calculation basis |
|---|---|---|---|
| Taxi | PDF invoices, 4 suppliers, inconsistent formats | Azure Document Intelligence (table + OCR) | Distance (Google Maps Routes API) × DEFRA factor |
| Boat fuel | PDF invoices | Azure Document Intelligence | Litres × fuel-type factor |
| Company vehicles | PDF invoices | Azure Document Intelligence | Litres/kWh × fuel or energy factor |
| UK electricity / gas | PDF invoices, multi-reading billing periods | Azure Document Intelligence | kWh × WTT/T&D factor |
| International travel | Structured Excel export | Direct parsing | Distance (flights), nights (hotels), spend (hire cars) × factor |
| Purchased goods & services | CSV export, 17,000+ rows/year | Direct parsing + SIC classification | Spend × SIC-code-derived factor, inflation-adjusted to base year |
A recurring engineering challenge across sectors was format drift — the same supplier changing invoice layout mid-year, or a company being acquired/rebranded and issuing invoices under a new name. The extraction and classification logic was built to detect and handle this explicitly (e.g. matching multiple known aliases for the same underlying supplier) rather than assuming format stability.
05
Where AI was used — and where it deliberately wasn't
A specific design principle throughout: use AI where judgment is genuinely required, use deterministic logic everywhere else. This kept the system fast, cheap to run, and predictable to test.
Used deliberately
- Supplier classification for Purchased Goods & Services. Where a supplier has no SIC (industry classification) code on file, the system queries Companies House, and an LLM reviews the candidate matches, returning a confidence rating (High/Low) and a plain-English justification for its choice. High-confidence matches are suggested with a pre-filled code and factor; low-confidence matches are left for manual lookup rather than guessed. Every suggestion — accepted or rejected — is logged, and accepted mappings are reused automatically for that supplier going forward.
- A natural-language reporting assistant, scoped specifically to answer questions about current figures and outstanding review items, with its available context deliberately limited to what it can answer accurately.
Deliberately not used
- Duplicate detection — implemented as file-hash and composite-key matching, not fuzzy AI comparison. Deterministic, instant, and testable.
- Supplier rebrand/alias handling — plain text matching against known aliases, not an AI classification call. A rule is sufficient where the mapping is genuinely fixed and known in advance.
- Plausibility/sanity checking — implemented as explicit numeric bounds per sector, not an AI-judged anomaly detector. This was a deliberate trade-off: a rules-based check is instant, free to run, and 100% consistent; an AI-judged version would be more flexible but slower, costlier per run, and non-deterministic — not the right trade-off for a safety-critical validation layer running on every single record.
06
Notable engineering decisions
Large-file handling. The Purchased Goods pipeline processes CSV exports exceeding 17,000 rows. An early version passed the file through the workflow as base64-encoded data, which expanded significantly in memory as it moved through successive processing steps, eventually exceeding available memory on the orchestration platform — a failure with no clear error message, since the process was simply terminated. The fix was architectural, not a patch: the frontend now uploads the file directly to object storage, and the workflow receives only a signed URL, fetching the file itself only at the point it's actually needed. The large payload never travels through the rest of the pipeline.
Year-aware factor switching. UK government conversion factors update annually. Rather than hardcode a single year's factors, the factor-lookup step reads a factor_year parameter supplied at run time, and the underlying tables store multiple years' factors side by side. This was designed in from early in the build, anticipating the year-end transition, and required no structural change when the new year's factors needed to go live.
Security. All 30+ database tables enforce Row Level Security, with read access scoped appropriately and privileged write operations routed through service-role, server-side functions rather than exposed client-side credentials.
Duplicate protection. Implemented at two independent layers — file-hash checking (has this exact document been processed before) and row-level composite-key checking (has this specific line item, e.g. a given invoice number and date, been recorded before) — so a duplicate can't slip through even if one layer is bypassed.
07
Reliability: the sanity-check layer
Extraction from real-world documents occasionally produces a technically-valid but implausible value — for example, an invoice number misread into a quantity field, or a multi-page document's metadata misread as tabular data. These failures don't throw an error; they produce a number that looks like a normal result.
A dedicated validation step was added to four of the highest-risk sectors, checking each calculated result against sector-specific plausibility bounds (e.g. a single taxi trip exceeding a realistic maximum distance, or a fuel quantity exceeding a realistic single fill). Anything outside those bounds is withheld from the reported total entirely and routed to a review queue with the specific reason attached — so an implausible figure can never silently reach a report.
This layer was itself tested adversarially before go-live: a batch-processing edge case (the check initially only evaluating the first item in a multi-item file) was identified and fixed during pre-launch testing, using a deliberately constructed multi-invoice test case rather than relying on the first real-world batch to surface it.
08
Validation & results
Before go-live, every sector was independently reconciled — not just spot-checked — against source documents and, where available, confirmed prior-year figures.
- Taxi: over 100 individual trips manually verified against source pickup/dropoff addresses across all four suppliers. Every trip that completed automated processing matched, within normal route-calculation variance.
- International travel: three full months, spanning the reporting year, reconciled row-by-row against source data — 372 individual line items, 100% accounted for (either calculated, or correctly flagged with a specific, verifiable reason).
- UK gas / electricity: matched confirmed prior-year figures exactly, or within under 0.1%, after resolving two extraction issues found during validation.
- Purchased goods & services: matched confirmed prior-year figures at 99.4% across 1,000+ suppliers and 17,000+ line items.
Issues found and resolved during validation (a deliberate part of the process, not an afterthought):
- A utility-billing extraction bug that under-counted consumption on invoices spanning a mid-period rate change, affecting a subset of monthly figures — identified via an anomalous cost-per-unit ratio during review, not a system error.
- A cross-sector spend classification that had an incorrectly-applied emissions factor for one transaction category, found through direct comparison against source calculations, confirmed, and corrected retroactively.
- A reporting discrepancy between the new system and an existing spreadsheet-based process, resolved by applying a materiality check — annualising both figures against a confirmed prior-year total showed the new system's figure implied plausible year-on-year growth, while the legacy figure implied an implausible multi-fold increase, correctly identifying the discrepancy's source.
09
Outcome
The platform now runs as the primary calculation and reporting system for the sectors in scope, with:
- A live dashboard showing current-year totals by scope and sector, with drill-down to source data.
- An automated review queue that routes anything uncertain to a human, with full context, rather than estimating.
- Full traceability from any reported figure back to its source document and the exact factor applied.
- The infrastructure to support quarterly (or more frequent) reporting cycles without a proportional increase in manual effort.
About the build
Built independently — from initial scoping through architecture, extraction pipelines, AI-assisted classification, frontend development and production validation across every in-scope sector. The system was developed against a real business process and validated against real data before being put into use.